Would you heat and cool your home with the front door and windows open?
Like me, many homeowners are looking for energy savings in their homes because we know that energy prices will be and are skyrocketing! We check the efficiency of our furnaces, air conditioners, water heaters, kitchen appliances, bathroom ceiling fans scouring our home for ways to save mother earth and our pocketbooks. Checking your home’s performance is the place to start, the ceilings, attic, windows and other energy loss areas. Many homeowners think that spending thousands of dollars on new appliances will save them from dishing out big bucks on heating and cooling their homes. Start with calling Complete Building Solutions, we work with many homeowner associations and homeowners to make their homes perform and become more energy efficient. Read the testimonial below from one of our customers who was elated by our completion of the elimination of bypass, insulation and ventilation correction and saving money far above their expectations!
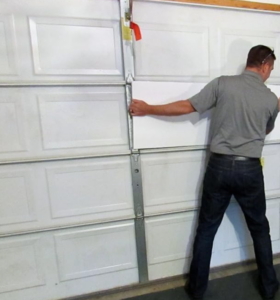
Complete Building Solutions has saved money for over 115 homeowner associations, townhome and condominium complexes (around 2,000 homeowners in the Twin Cities area alone). Our engineering firm has concrete methods to measure a home’s energy inefficiency and create a path to mending homes. Aside from a detailed attic visual inspection, we can also offer infrared camera analytics, moisture testing, and negative blower door testing. The negative blower door test determines how many CFM’s (cubic feet per minute) of energy your home is losing. These tests are sometimes done before we work on a home and after the work is completed and sometimes, over a two year period. Typically after a home’s performance is maximized by fixing heat loss areas, a homeowner can save around 25-50% on their energy bills. These savings and your investment will actually pay for themselves over a period of time.
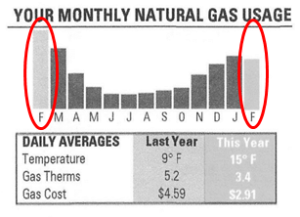
One of our homeowners, Dr. Tracy was elated when we saved him just under 50% of on his energy costs:
“So, thanks again for a job well done! In addition to this very noticeable drop in natural gas usage, we are also noticing that we don’t have to keep the thermostat set as high to keep the house warm, the furnace doesn’t seem to run as often, the upstairs rooms are nice and warm (they were cold in years past), and, of course, no large-scale ice buildup along the roof lines anymore. There’s some ice in some corner spots but nowhere near as much as in years past.”—Dr. Tracy

This bar graph shows Dr. Tracy’s actual gas bill before our assessment and execution of our recommended work scope (left F) and after (right F). These represent the difference in gas usage between February 2014 and February 2015.


